Urban Expansion Imbalance
seen from the perspective of
night-time lights
From global patterns to regional mechanisms, this project uses night-time lights to trace where urban growth occurs, how it evolves, and why it is uneven across space.
Set your Mapbox token in
assets/js/app.js to load
the map.
China Trend
China Nighttime Lights and GDP Trend
National brightness growth, economic expansion, and key events from 2000 to 2024.
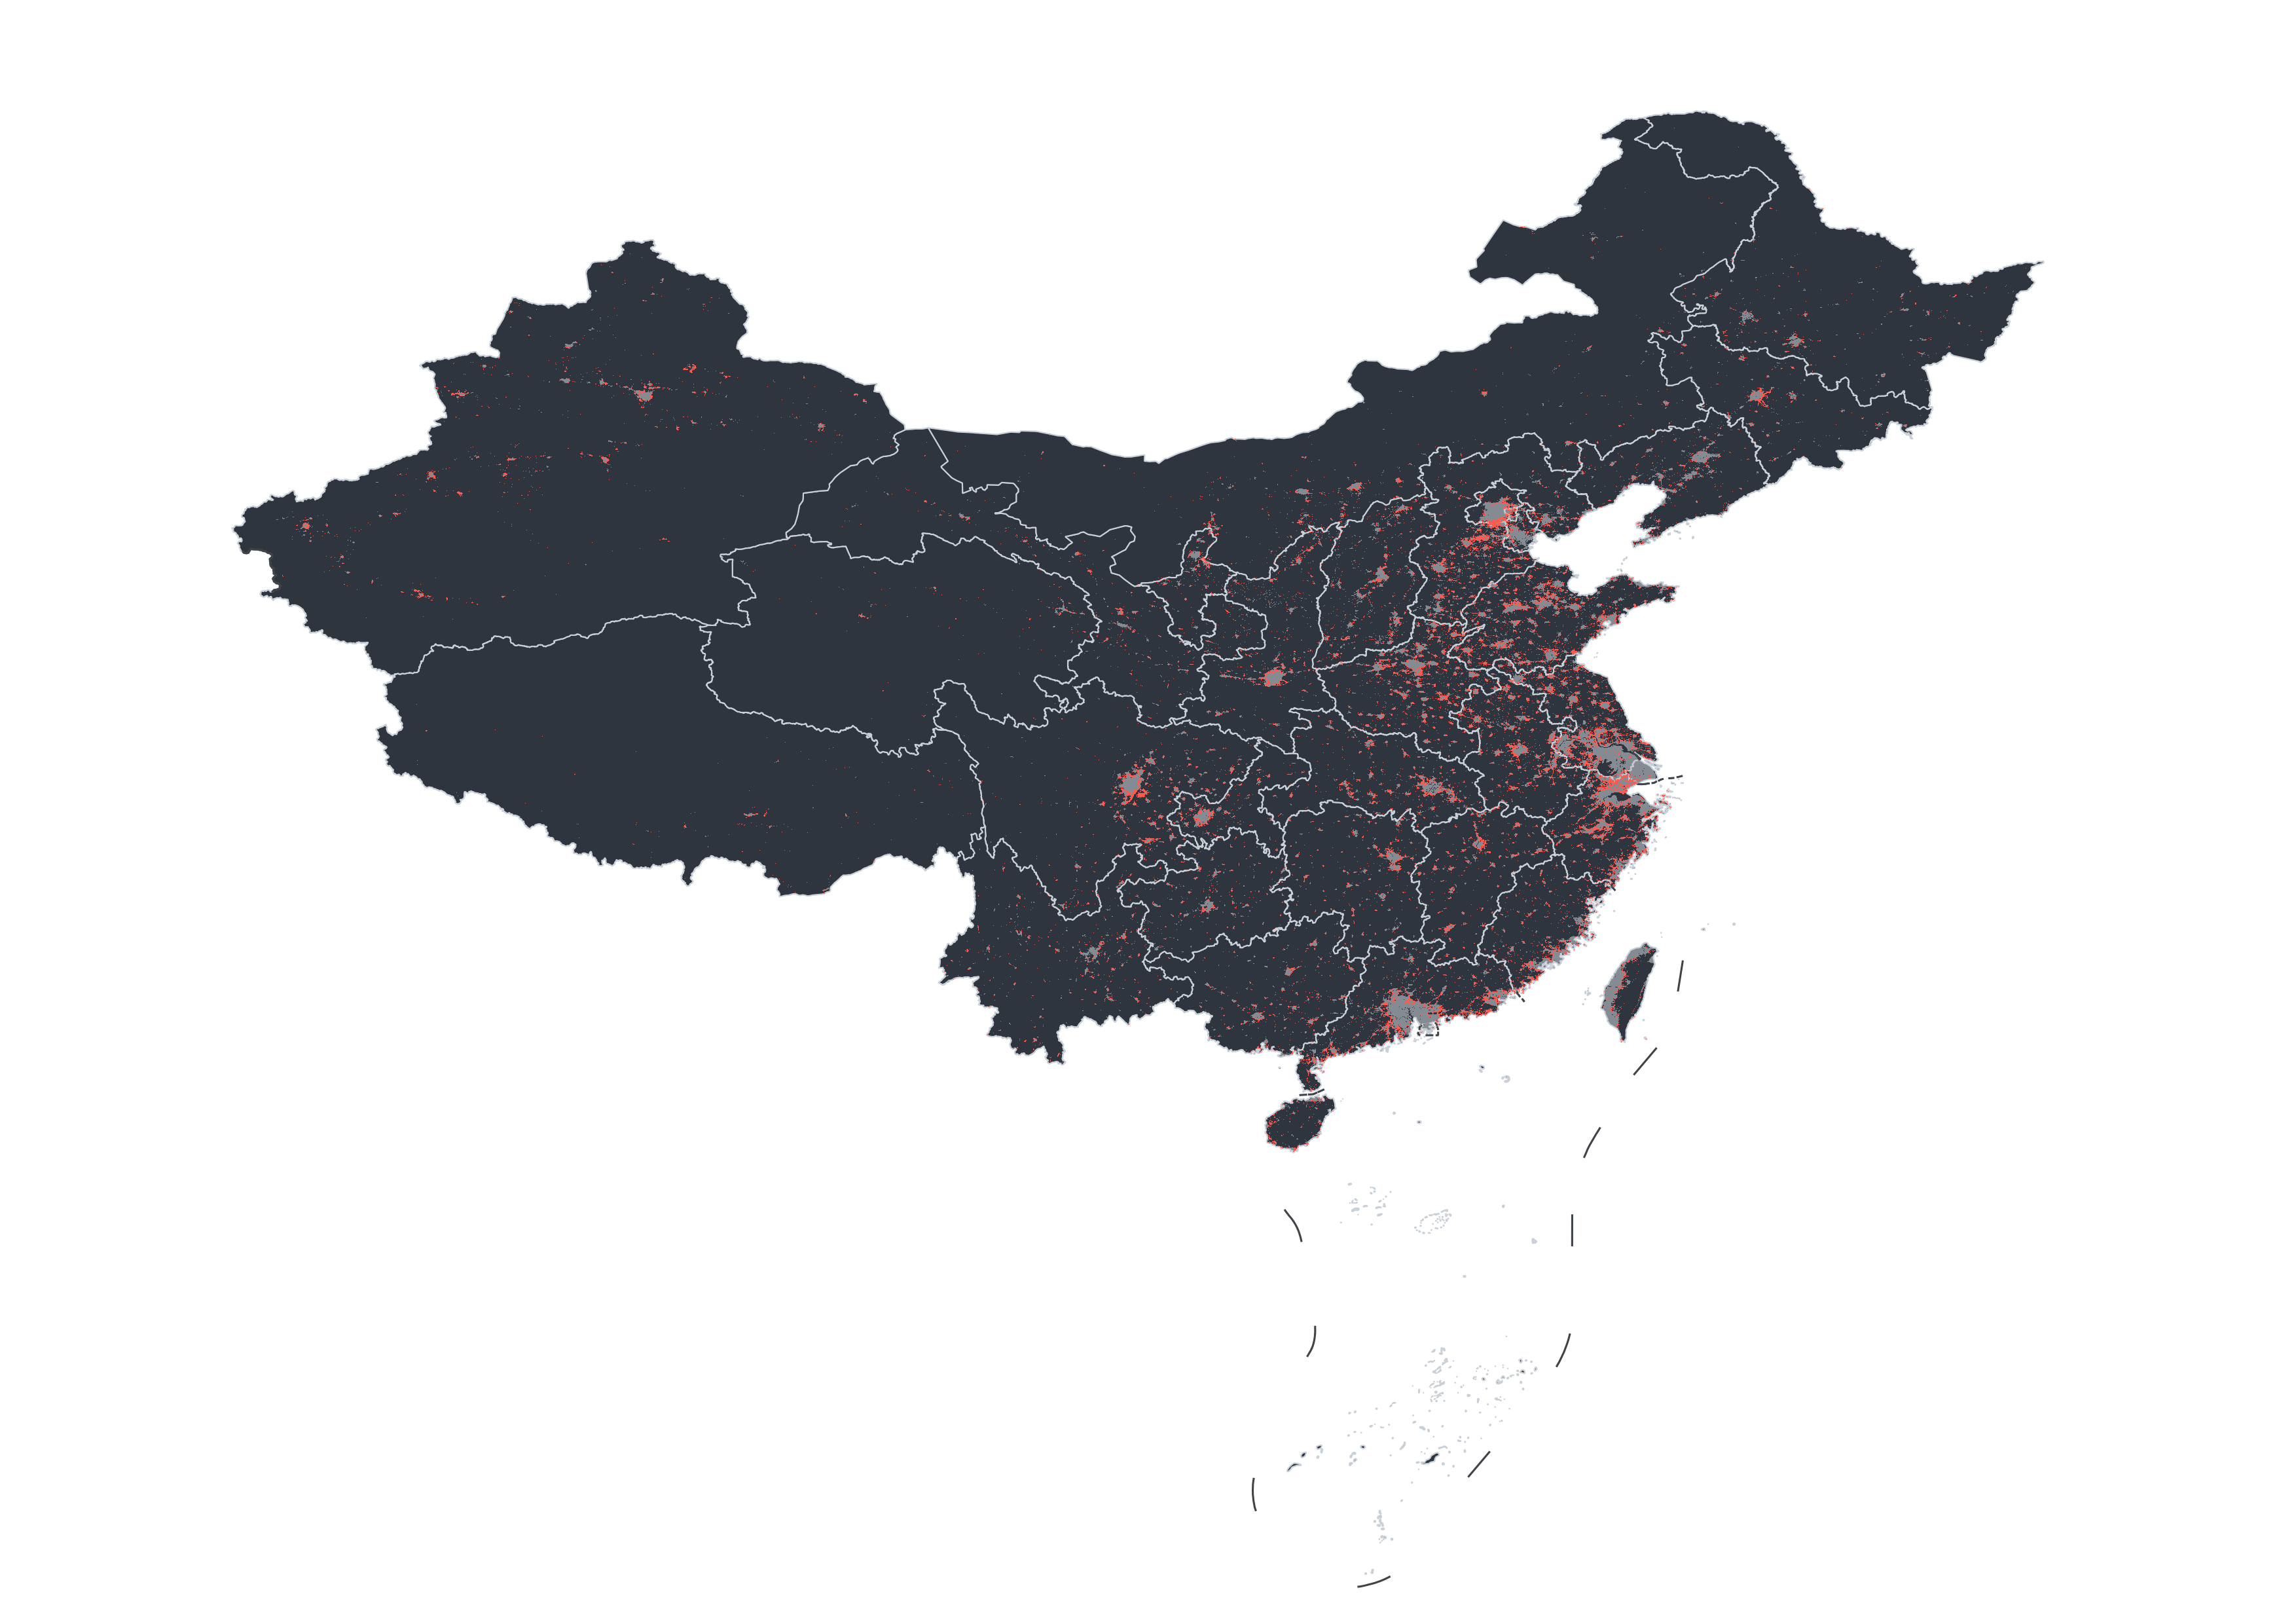
Bright Comparison
New & Stable Bright Areas and Urban Expansion in China
Compare the national pattern, zoom into the PNG maps, and inspect three key urban regions from 2014 to 2024.
Corridor Analysis
Transport Corridors and Urban Expansion
Explore how major transport corridors shape city growth patterns across China, 2012–2022.
Hierarchy Analysis
City Hierarchy, Growth Coordination & Functional Support
Drag the dividers to compare T1, T2 and T3 city tiers. Click any city for details.
Tier 1 · Super-tier Cities
Tier 2 · Second-tier Cities
Tier 3 · Third-tier Cities
Visual Encoding
Size = Growth Intensity
Color = Coordination
Ring = Growth Efficiency
Beijing · Super-tier Cities
City vs Tier Mean
POI Distribution
Credits
Our Creative Team
The people behind the pixels, data, and stories.